
2 TSX Dividend Stocks for TFSA Passive Income
Stock · November 13, 2026
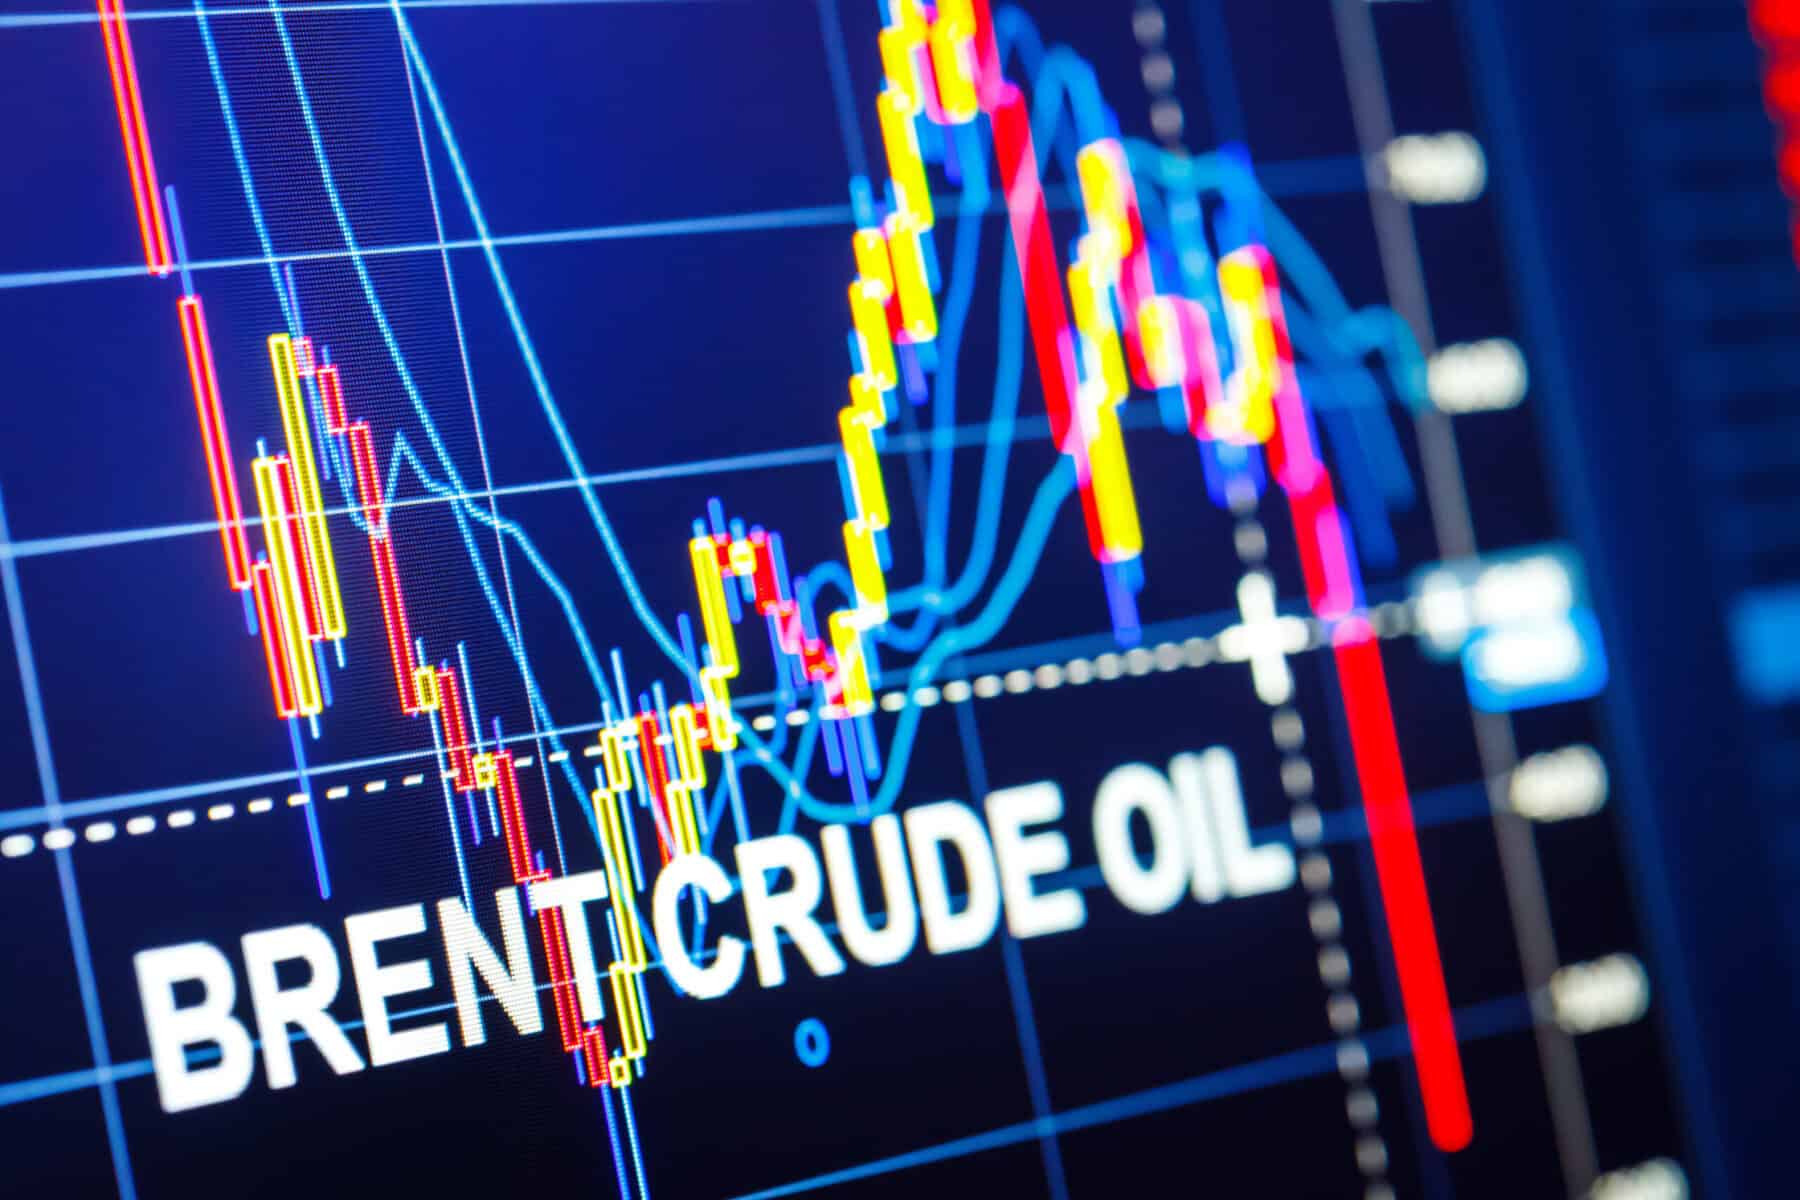
Market volatility is one of the most frequently discussed concepts in trading and investing, yet it remains widely misunderstood. Volatility measures how quickly and drastically the price of an asset changes over a given period. High volatility brings rapid price swings, while low volatility reflects relative price stability. For traders and investors, understanding these swings is crucial for managing potential losses and recognizing potential market opportunities.
Rather than reacting impulsively to sudden market swings, disciplined market participants use structured frameworks to analyze price behavior. Asking targeted questions helps traders distinguish between normal price noise and fundamental shifts in sentiment. Below are seven fundamental questions every market participant should evaluate when assessing market volatility.
The first step in evaluating price instability is identifying its root cause. Volatility typically stems from either macroeconomic shifts or microeconomic, company-specific events. Macroeconomic drivers include central bank policy decisions, inflation data, interest rate adjustments, and geopolitical developments. Microeconomic drivers, by contrast, involve quarterly earnings reports, regulatory decisions, management changes, or unexpected product disruptions.
Understanding the source of price movements prevents misinterpretation. For example, a sharp drop in a technology benchmark like the Nasdaq 100 caused by a Federal Reserve rate decision affects the broader equities market differently than a sharp drop in a single stock caused by an missed earnings estimate. Recognizing whether volatility is systemic or localized helps traders select the appropriate risk parameters.
Traders must distinguish between historical (realized) volatility and implied volatility. Historical volatility measures actual price fluctuations that have already occurred over a specific timeframe, such as 30 or 90 days. It provides an objective look at how wildly an asset has moved in the past.
Implied volatility, on the other hand, is a forward-looking metric derived from options pricing, reflecting the market's expectation of future price movement. The Cboe Volatility Index (VIX) is a standard benchmark used to gauge 30-day expected volatility in the S&P 500 index. Comparing implied volatility with historical volatility helps traders assess whether options pricing is currently inflated or deflated relative to past norms.
Risk management directly depends on current market conditions. When volatility expands, average true range (ATR) increases, meaning standard price moves cover wider point distributions. A position size that is appropriate during a quiet market can expose a trading account to unsustainable drawdowns during volatile periods.
Adjusting position sizes downward when volatility spikes allows traders to maintain consistent capital risk per trade. For instance, if an asset's daily price range doubles, reducing contract or share size by half helps preserve the same dollar exposure while giving the trade sufficient room to fluctuate without hitting overly tight stop-loss orders.
Market volatility rarely spreads evenly across all asset classes. Equities, foreign exchange, commodities, and fixed income respond to systemic shocks in distinct ways. Historically, high equity market volatility often coincides with flight-to-safety flows into assets like US Treasury bonds or spot gold.
| Asset Class | Common Volatility Drivers | Primary Benchmark Indicator |
|---|---|---|
| Equities | Earnings releases, rate expectations | Cboe Volatility Index (VIX) |
| Foreign Exchange | Central bank policy divergence | JPMorgan Global FX Volatility Index |
| Commodities | Supply chain shocks, geopolitical events | Cboe Crude Oil Volatility Index (OVX) |
| Fixed Income | Inflation prints, monetary policy shifts | ICE BofA MOVE Index |
Monitoring cross-asset volatility metrics provides broader context. A sudden spike in currency volatility, for example, can precede fluctuations in multi-national corporate earnings, ultimately spilling over into equity benchmarks.
The significance of market volatility depends heavily on a trader's time horizon. Short-term day traders actively seek volatility, relying on intraday range expansion to execute momentum or mean-reversion strategies. Without volatility, short-term trading opportunities diminish significantly.
Conversely, long-term investors holding core allocations in major index funds or retirement accounts like a 401k or IRA generally view short-term volatility as noise. For long-term horizons, reacting to short-term fluctuations can lead to premature exits or missed compound returns. Clarifying whether your strategy is intraday, swing, or multi-year ensures you react appropriately to price swings.
Traders across different jurisdictions face distinct regulatory mechanisms designed to mitigate extreme price fluctuations. In the United States, equity markets utilize market-wide circuit breakers governed by the Securities and Exchange Commission (SEC) and major exchanges like the NYSE and Nasdaq. These rules halt trading automatically if major indices drop by specific percentage thresholds (7%, 13%, and 20%) relative to the previous day's close.
Understanding these mechanisms prevents confusion during market panics. Other international jurisdictions employ similar price bands or volatility halts through institutions like the UK Financial Conduct Authority (FCA) or the Australian Securities and Investments Commission (ASIC). Knowing the structural rules of your specific trading market is essential for managing execution risk during extreme conditions.
Heightened market volatility activates cognitive biases such as loss aversion and fear of missing out (FOMO). During severe downturns, fear can tempt traders to abandon pre-planned stop losses or panic sell at market bottoms. Conversely, during rapid rallies, greed can lead to over-leveraging without a clear risk plan.
Maintaining a disciplined trading log and adhering strictly to documented risk parameters mitigates emotional bias. Evaluating trade performance based on process execution rather than short-term financial outcomes builds long-term consistency through volatile market cycles.
Market volatility is neither inherently positive nor negative; it is simply a measure of price variance. By systematically addressing these seven questions, traders and investors can navigate uncertain market environments with structured discipline. Rather than attempting to predict short-term swings, successful market participants focus on controlling risk exposure, selecting appropriate trade structures, and maintaining strategic clarity across changing market cycles.




Why this matters to US investors: Why this matters to US investors: Understanding volatility metrics like the VIX and SEC market-wide circuit breakers helps US traders manage risk effectively across major domestic exchanges like the NYSE and Nasdaq.