
Forex Trade Management – What to do After You Enter a Trade
Forex · July 15, 2026
Most of you know I publish a daily market commentary each day shortly after the daily Forex market close. What many of you probably do not know is that making these commentaries each day is part of my daily chart analysis and trading routine. I actually started writing down my thoughts about the markets each day well before I started this website, and it’s something I’ve done continuously every trading day for about the last decade. It’s literally a habitual part of my daily life…if I miss a day of commentary for some odd reason, like travel or a holiday, I literally feel ‘strange’, and like something is ‘missing’.
My daily trading routine is the core foundation that all of my trades are built on, and it’s my opinion that all aspiring traders need such a foundation to build their trading career on if they want to have a serious chance at making consistent money in the markets. In today’s lesson, I am going to show you how I personally analyze the charts each day and give you a ‘peak’ into my daily trading routine. Hopefully, after reading today’s lesson you will have a better understanding of WHY you need a daily trading routine and HOW to develop one.
News just came out over the last week that Bill Gates, founder of Microsoft, is once again the richest man in the world. The one thing that you will never hear anyone saying about ultra-successful people like Gates and others, is that they are ‘lazy’ or have ‘bad habits’. It’s pretty well understood that a man like Bill Gates must be a very disciplined individual to have gone from college drop-out to richest man in the world and founder of the biggest software company on earth. Most people would agree he has probably developed some very effective daily habits that have brought him to the point he is at now in his professional life.
This leads me to my next point: How do YOU analyze your charts each day to find trades? Do you have a routine that you go through each day? Do you have any structure behind your trading method or do you basically just “trade on the fly”? Like success in any other field, trading success is the result of developing effective habits through discipline and proper procedure. What I mean is this; if you do not have the discipline to stick to your trading strategy and manage your risk properly, you will never attain the trading mindset and habits that you need to make consistent money in the markets.
At this point in my trading career, I am very set in my daily routine, yes it’s a little ‘boring’ at times, and repetitive, but I still do it because it’s a habit, and a very effective one at that. Each day, I go through my ‘ritual’ of checking the markets, making notes, placing trades if there any, wash and repeat. I got an email recently from someone who insisted that there was some “secret to trading” that I was not telling them, they actually didn’t believe me the first time I responded saying that there really is no “secret” besides discipline and proper money management. The real “secret” to trading success, if there is one, is that YOU need to develop yourself into a successful trader by learning to trade effectively and being disciplined long enough to follow a trading routine until it becomes a habit that you don’t even have to think about anymore.
Here’s how I do it…
My daily trading routine is probably a lot less complicated than you might think…the most important thing to remember is that it has become a habit for me, just like it should be for you. The walk-through that follows is essentially how I create my daily market commentary for the members area each day, hopefully this will give you some insight into how to create a daily trading routine and trading plan…
Levels
The first main thing I do at the start of each new trading week as well as each day, is map out where the key chart levels are and watch how the market is reacting around them. I first zoom out to the weekly chart and get a quick view of where the key levels are, at that time I will draw them in on my charts.
In the weekly EURUSD chart below, I have drawn in the key weekly support and resistance levels as I do at the start of each new trading week. I am looking for levels that were key turning points in the market and then drawing a horizontal line across those levels, this is essentially how to draw support and resistance levels:
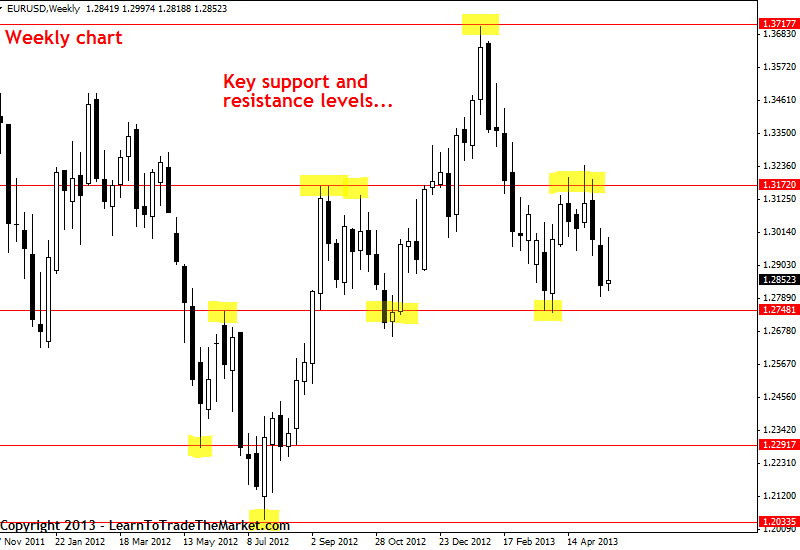
After I’ve drawn in the key weekly chart levels I will move down to the daily chart time frame. Here, I will probably see some of the same key levels I drew in on the weekly, but because I am not looking at as much data (time), some of the weekly levels won’t be relevant on the daily. There will be other levels to draw in on the daily chart; shorter-term levels.
In the daily EURUSD chart below, you can see the most relevant key support and resistance levels that I’ve drawn in. Note that I actually adjusted the weekly level that was at 1.3172 in the chart above, up to about 1.3193 on the daily chart, because it’s a little more obvious that the ‘actual’ level is up a little more once you drill down to the daily chart. Also note that I added in a level on the daily chart at 1.2955 that was not really obvious on the weekly chart. You will add more levels as you switch from the weekly to daily because some of them are simply not as obvious on the weekly.
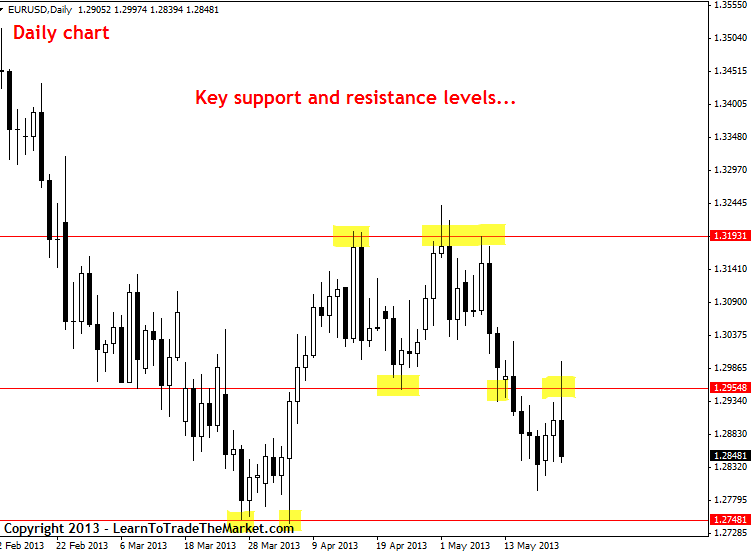
Note how I have drawn in the key support and resistance levels in the chart above. I did not draw in every single little level I could find, rather, I focused on the levels that were CLEARLY important, and by that I mean the ones that caused price to make a significant change of direction. As you go lower in time frame you will naturally have more key levels to draw in, and finding and drawing them is NOT an exact science, there is discretion involved and you WILL get better at it through education and screen time.
Here are some of the key things I am looking for at these levels:
Determining market condition
The next I do after finding the key chart levels and analyzing what’s happening around them, is determine the condition of the market; is it a trending market, range-bound, or chopping sideways with no direction? This is very important because it basically decides how you will approach the market and how you will trade it.
The first thing I do is have a look at the weekly chart again and I will take note of the general direction the market has been moving in recent weeks. This can be called the “long-term trend”, and I am really just trying to get a general feel here for what the market has been doing over the last year and whether or not there is a clear trend.
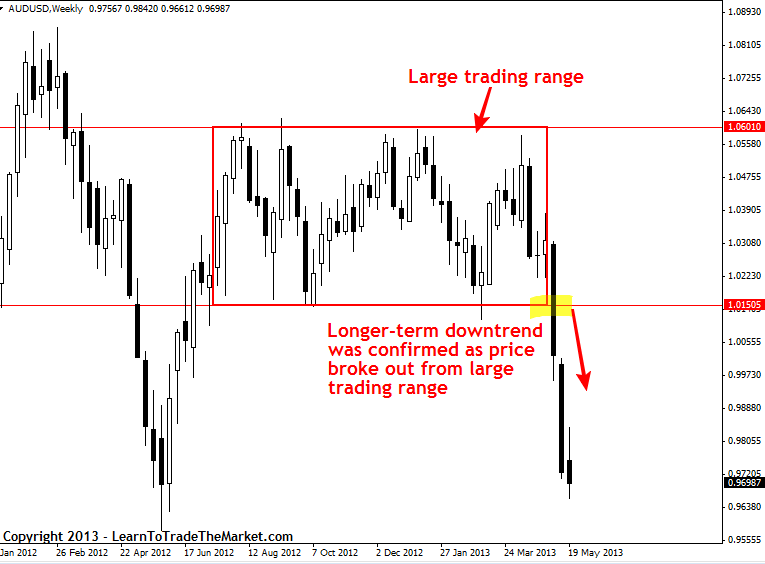
In the weekly AUDUSD chart below, we can clearly see how useful and important it is to look at the weekly chart before drilling down to lower time frames. The AUDUSD weekly chart shows us that the market was recently trading within a very long 9-month trading range and no real long-term trend was in place. However, when the market finally broke down and out from this trading range it essentially ‘confirmed’ that a new downtrend was getting started, and this is a very important piece of information to know as we drill-down and look for price action trading strategies on the daily, 4 hour charts and 1 hour charts…
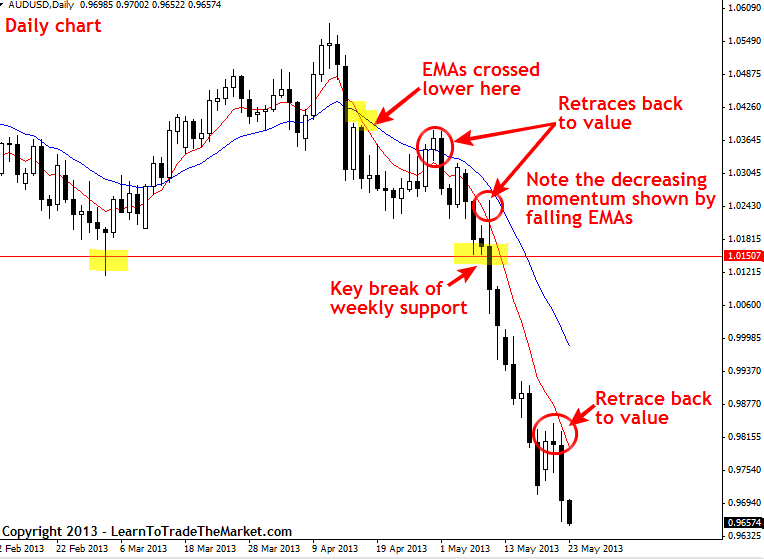
Now, let’s look at the AUDUSD again but this time we are looking at the daily chart time frame. In the chart below, we can clearly see that the 8 and 21 day EMAs show a potential trend change a lot earlier than you can detect it on a weekly chart. When we see the EMAs (red is 8, blue is 21) cross each other, it’s an indication the trend might be changing and is something to take note of. You generally need to see a pattern of lower highs and lower lows or higher highs and higher lows to “confirm” the trend change, but the EMAs are a good “early-warning” system that the trend might be changing. Read more about trend trading in my article on how to trade trends.
It’s important to note the retraces back to “value” in the chart below. In a downtrend, “value” means resistance, in an uptrend it means support. These do not have to be strict levels, they can be “zones” or even the “layer” between the 8 and 21 day EMAs, like we see in the chart below. When the market retraces back to these value areas, it means we need to pay extra close attention and look for price action signals to trade with the dominant daily chart trend. I look for signals on the 1 hour, 4 hour and daily charts.
Price action signals
Finally, after I’ve drawn in and analyzed the key chart levels and determined the current market condition, I will look for price action entry signals. A price action pattern is my main entry trigger and I will not typically trade if there is not a price pattern ‘confirming’ a high-probability entry into the market.
The primary thing I am looking for are daily chart price action signals, as these are the strongest and best ones to trade in my opinion. I always go through the markets and look for price action signals once at the close of the trading day and then again a little later on in the day.
I am basically just looking for obvious PA signals that are well-formed and that ‘agree’ with the current market dynamics. That means an obvious PA signal that is near a key level or in the context of a trending market. I am also looking for price action rejection / reversal signals at key chart levels or at “value” as described previously.
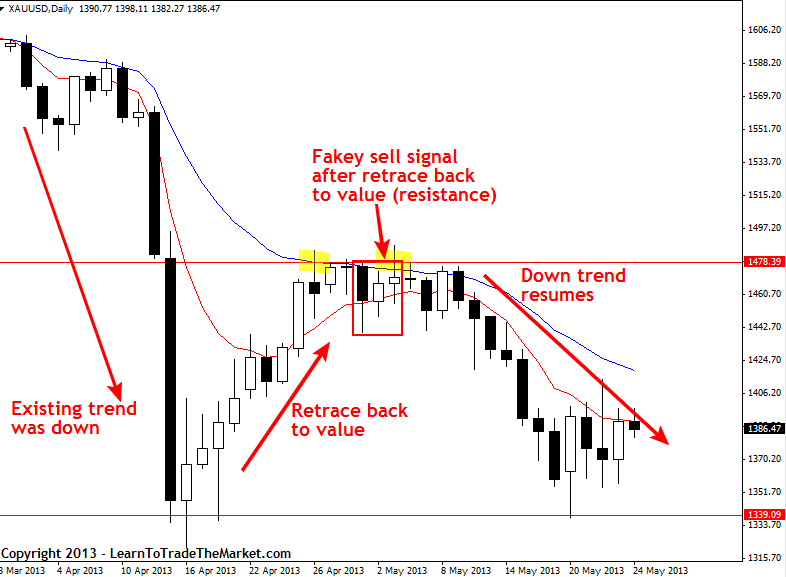
In the daily Spot Gold chart below, we are looking at an example of a fakey signal that formed after a retrace and subsequent false-break of value / resistance near $1,480.00. We discussed this setup recently in our May 7th Commentary and it shows a good example of how to trade in-line with a trend (downtrend in this case) after the market has made a retrace back to a key level of resistance as well as the 8 / 21 day EMA resistance layer.
Hopefully, you have learned a few things from today’s lesson. The primary things you should have learned are that: 1) You NEED a habitual daily trading routine that is simple yet logical and effective, and 2) Creating a daily trading routine is not difficult, the guidelines I discussed above are really about all you need each day to analyze the charts.
I strongly recommend you start doing your own daily market analysis and keep your notes in a diary. This ‘trading diary’ would look very similar to the daily chart commentary I create for my members every day. You can get started by just following the three main steps I described in this article. Keeping a ‘daily trading diary’ has benefited me greatly over the years because it allows me to track the market each day and remain “in the zone” as the market ebbs and flows.
An invaluable learning tool to help you become an expert at analyzing your charts is my daily market commentary newsletter. You can check out my daily chart analysis newsletter in the members’ area and follow along each day as I discuss key levels, market conditions and price action setups that may have formed that day. For more information on my daily trading newsletter, trading courses and traders community, click here.
The post Develop A Daily Routine For Analyzing Charts & Trade Setups first appeared on Learn To Trade The Market.

