Blockchain.com Taps Polymarket to Capture Event-Trading Demand Inside Its Brokerage App
Cryptocurrency · July 15, 2026
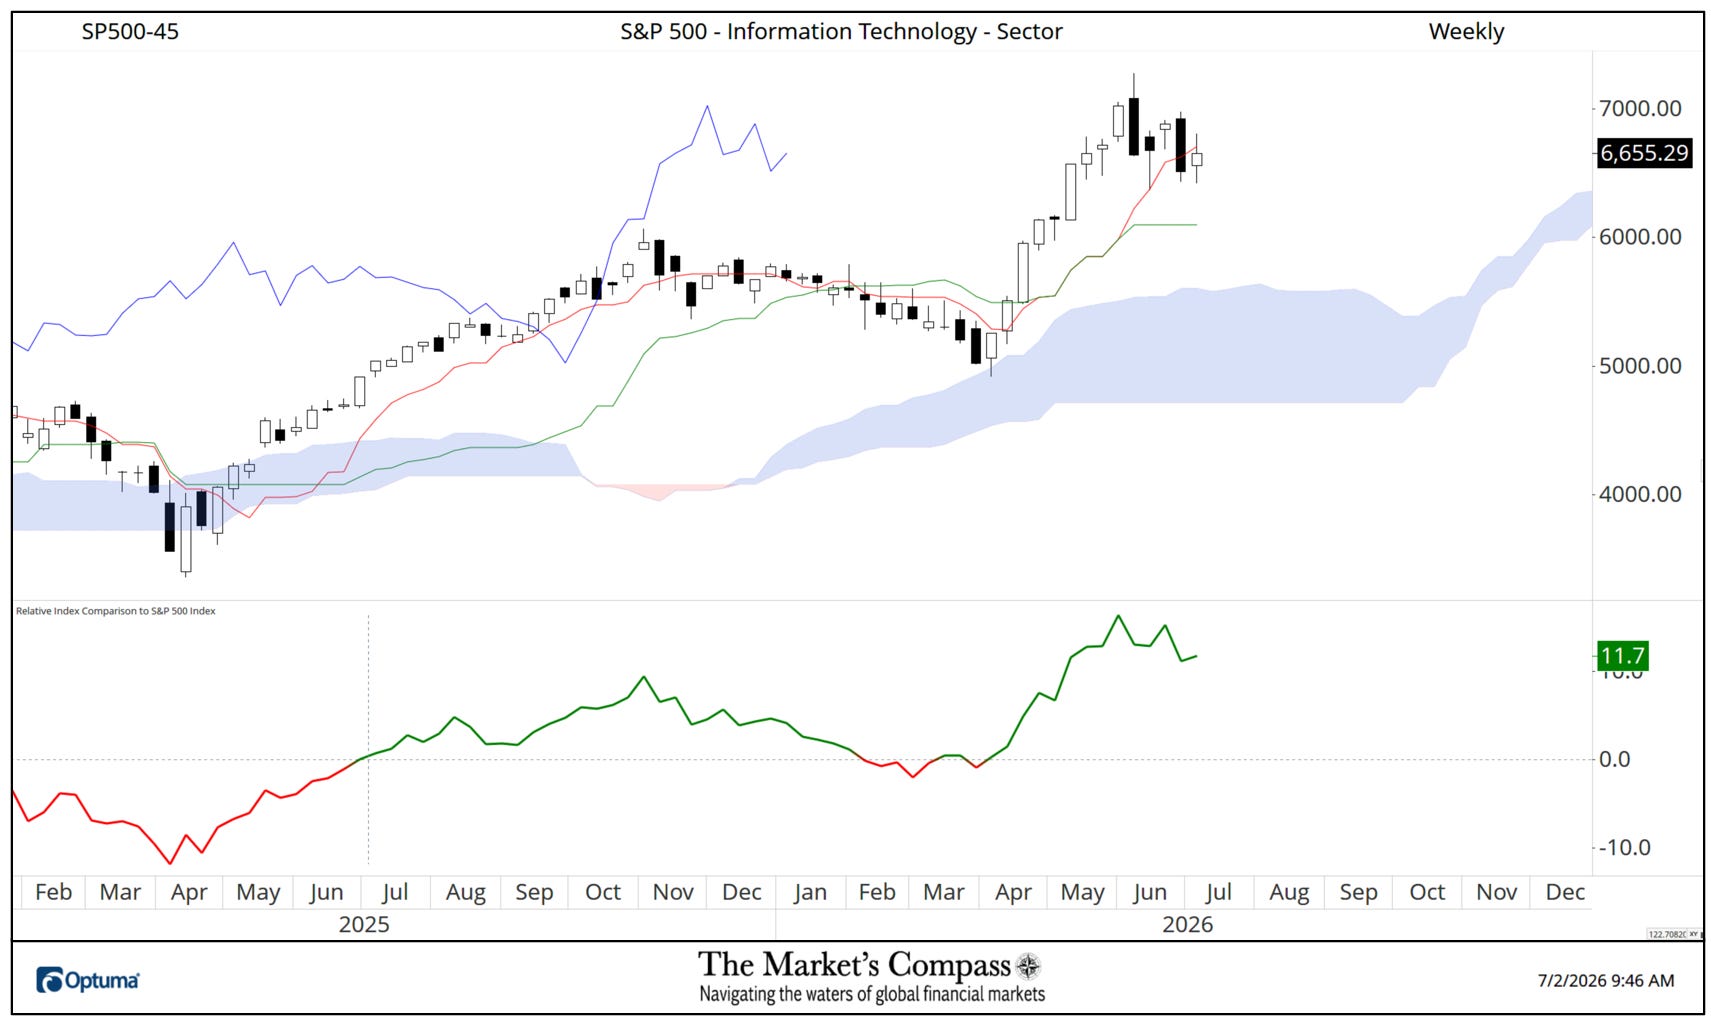
The charts that follow are the GICS Level 1 Industry Sectors Weekly Candlestick Charts with an added panel below that displays relative strength or weakness vs. the S&P 500 Index. The vertical dashed line in the bottom panel marks the July 1st, 2025, normalization date. The Charts are sorted from best to worst relative to the benchmark over that fixed period. As always, there have been several marked relative strength fluctuations since the normalization date. Example; the GICS Level 1 Energy Sector was up more than +42% vs. the S&P 500 Index in late March, now is up only +1.49% vs. the benchmark since this time last year. The scale to the right of relative strength panels are percentages vs. the benchmark (although the % designation is omitted).
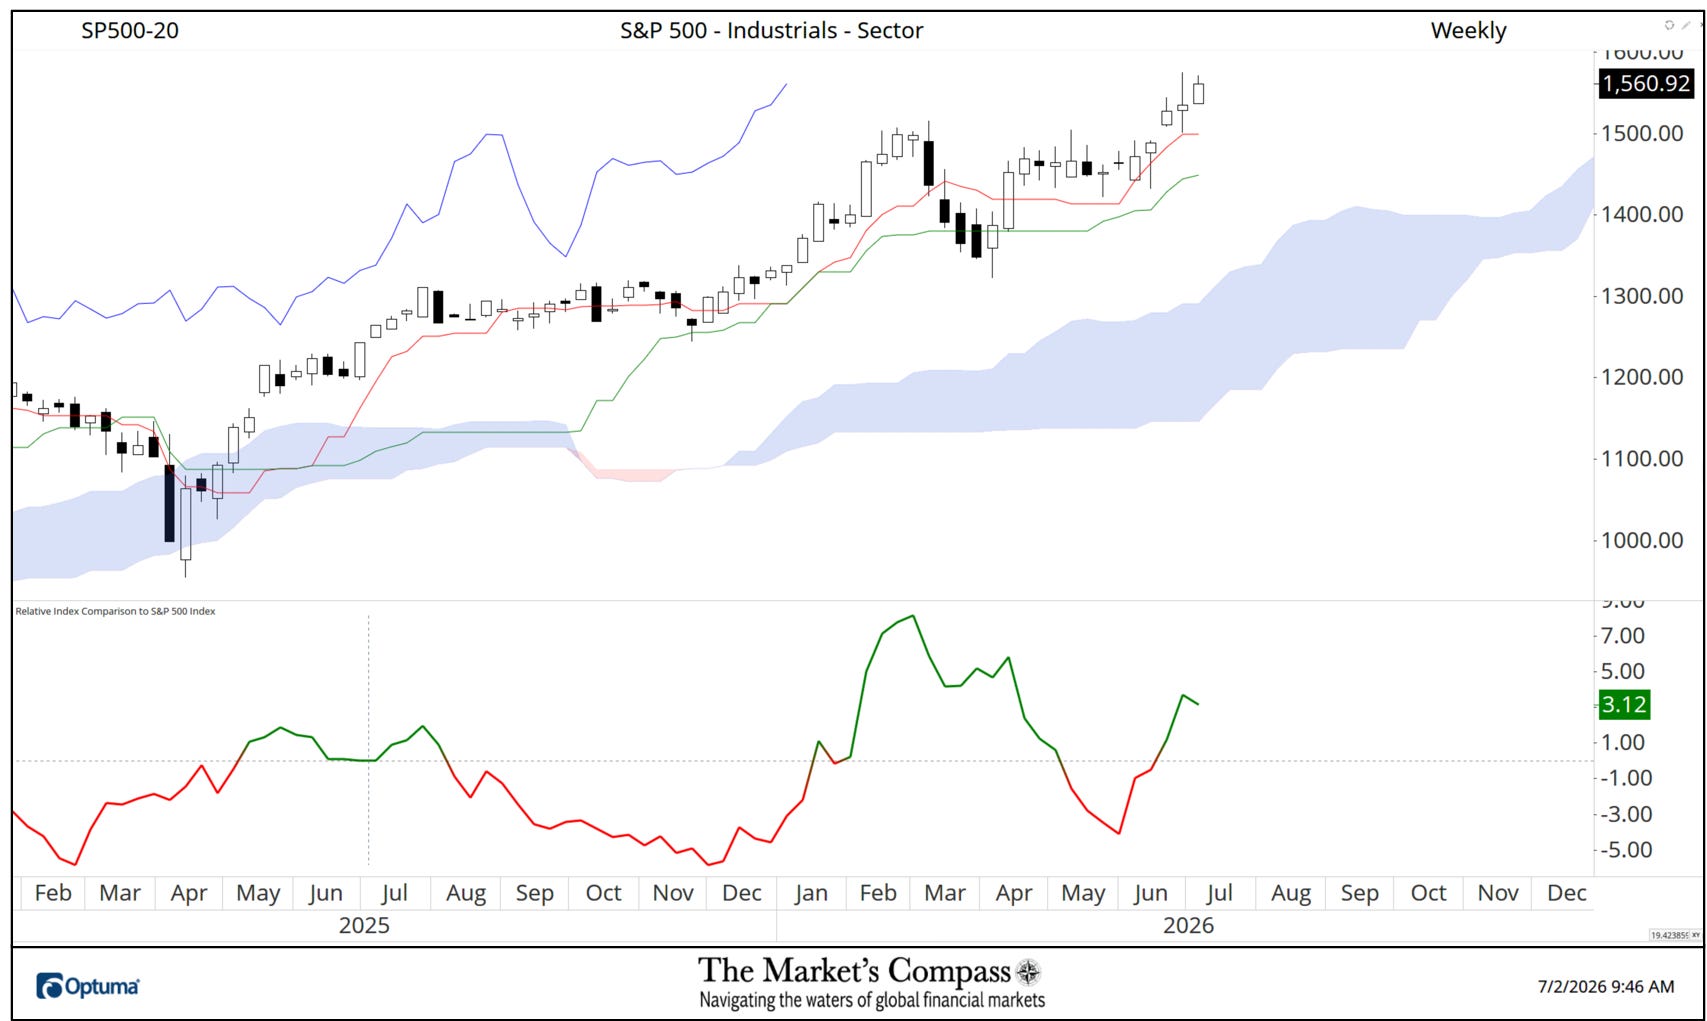
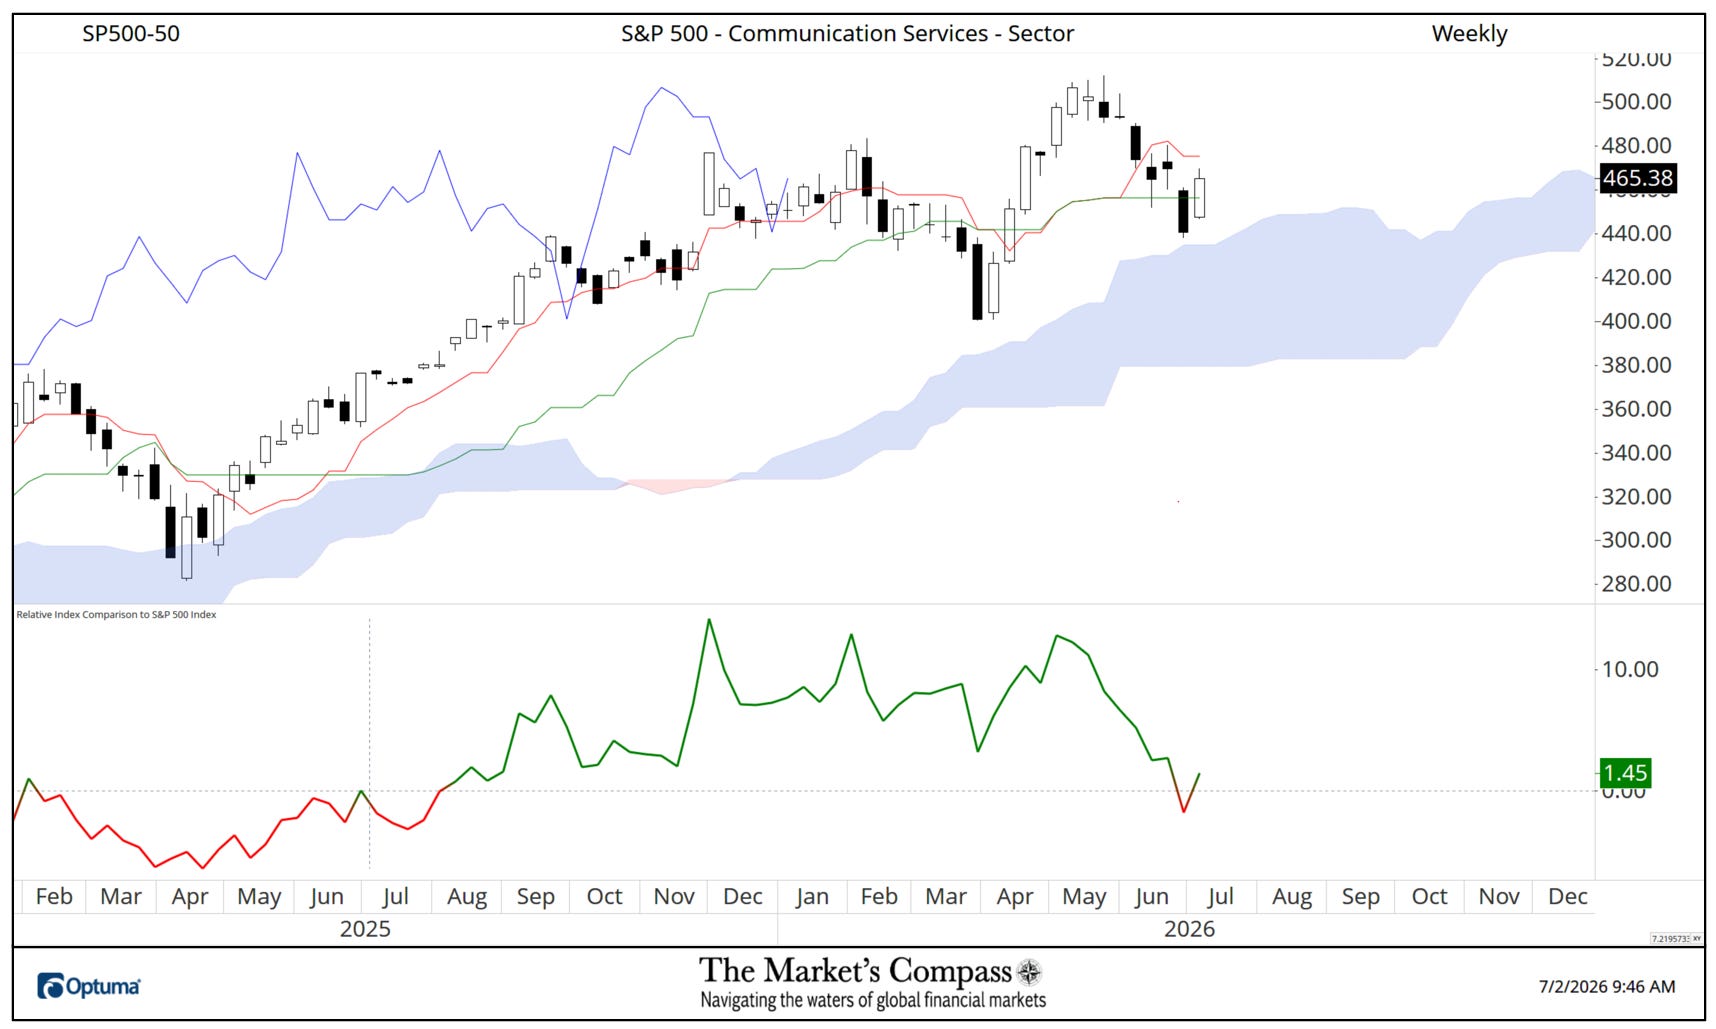
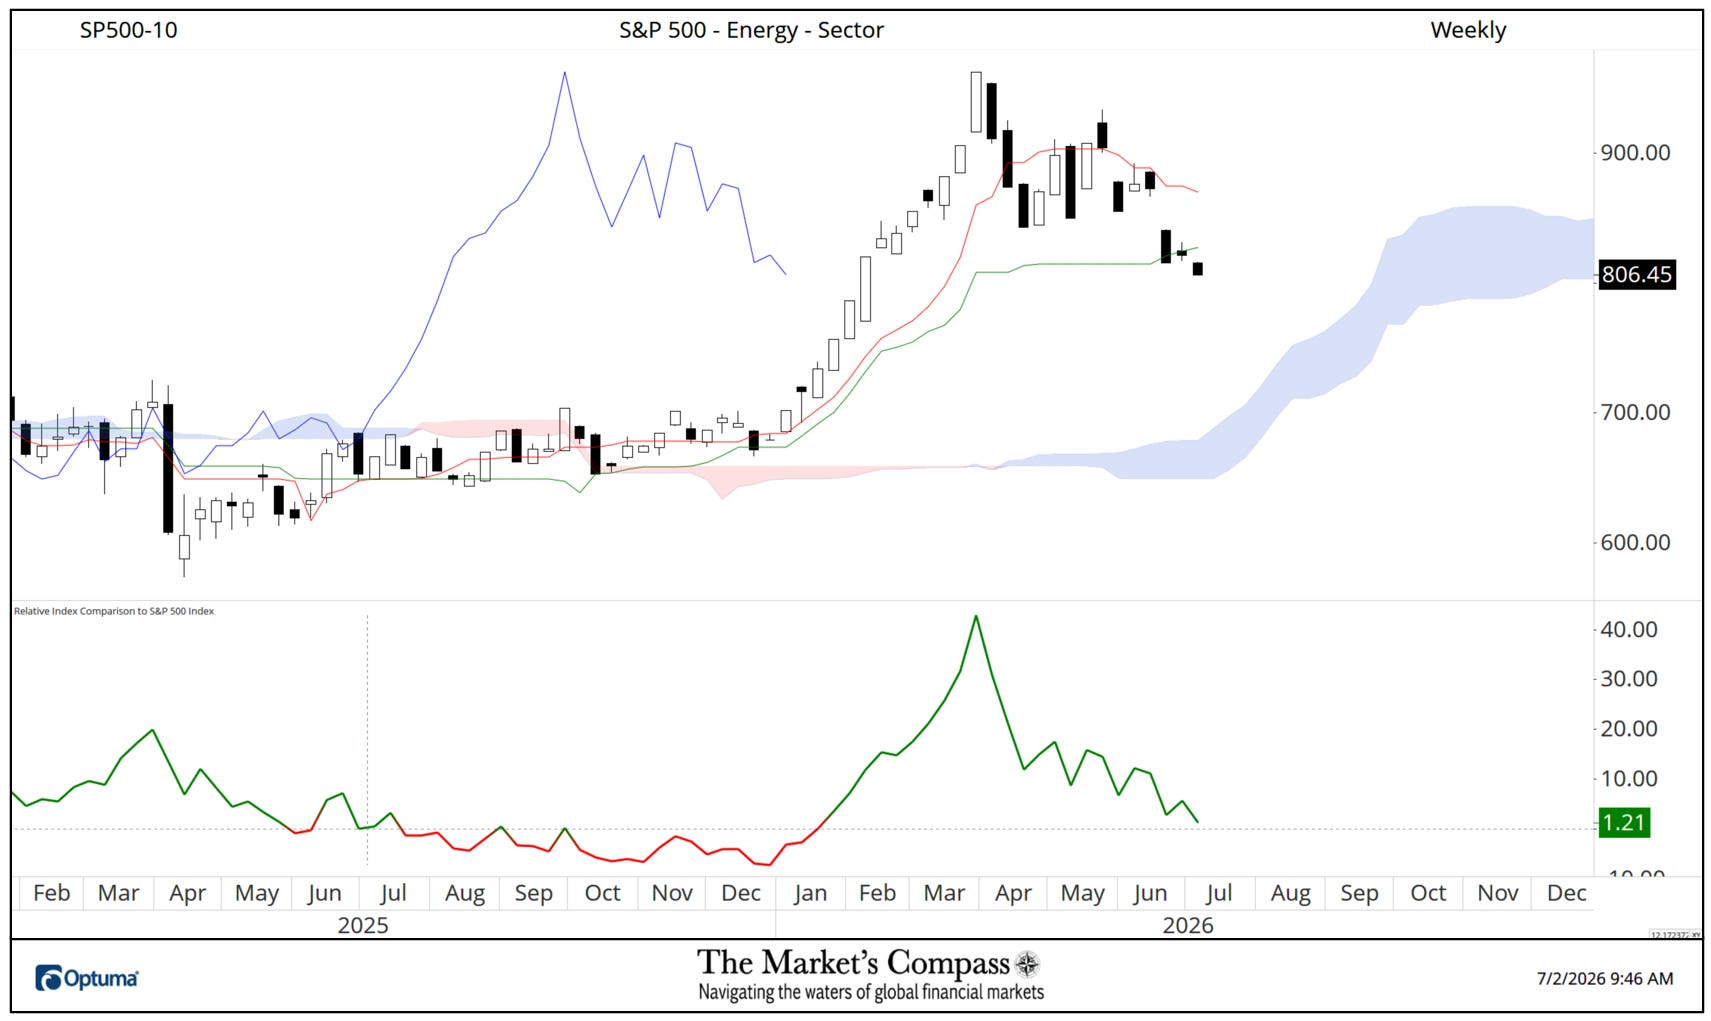
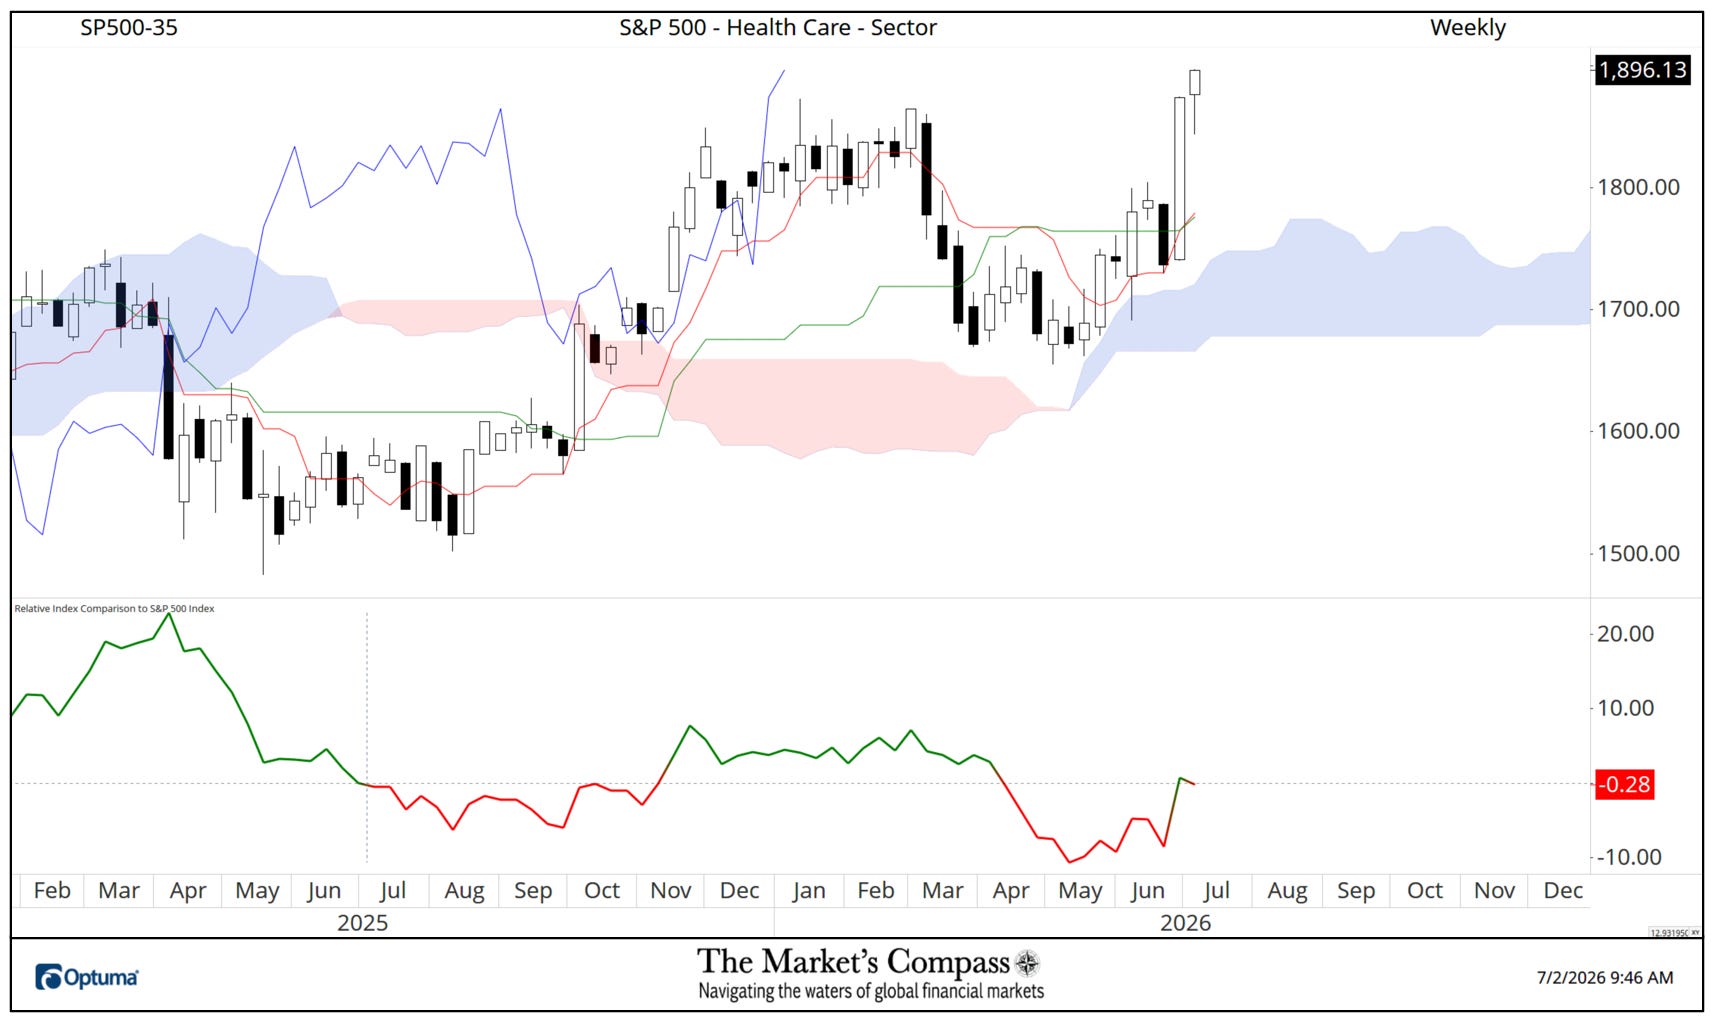
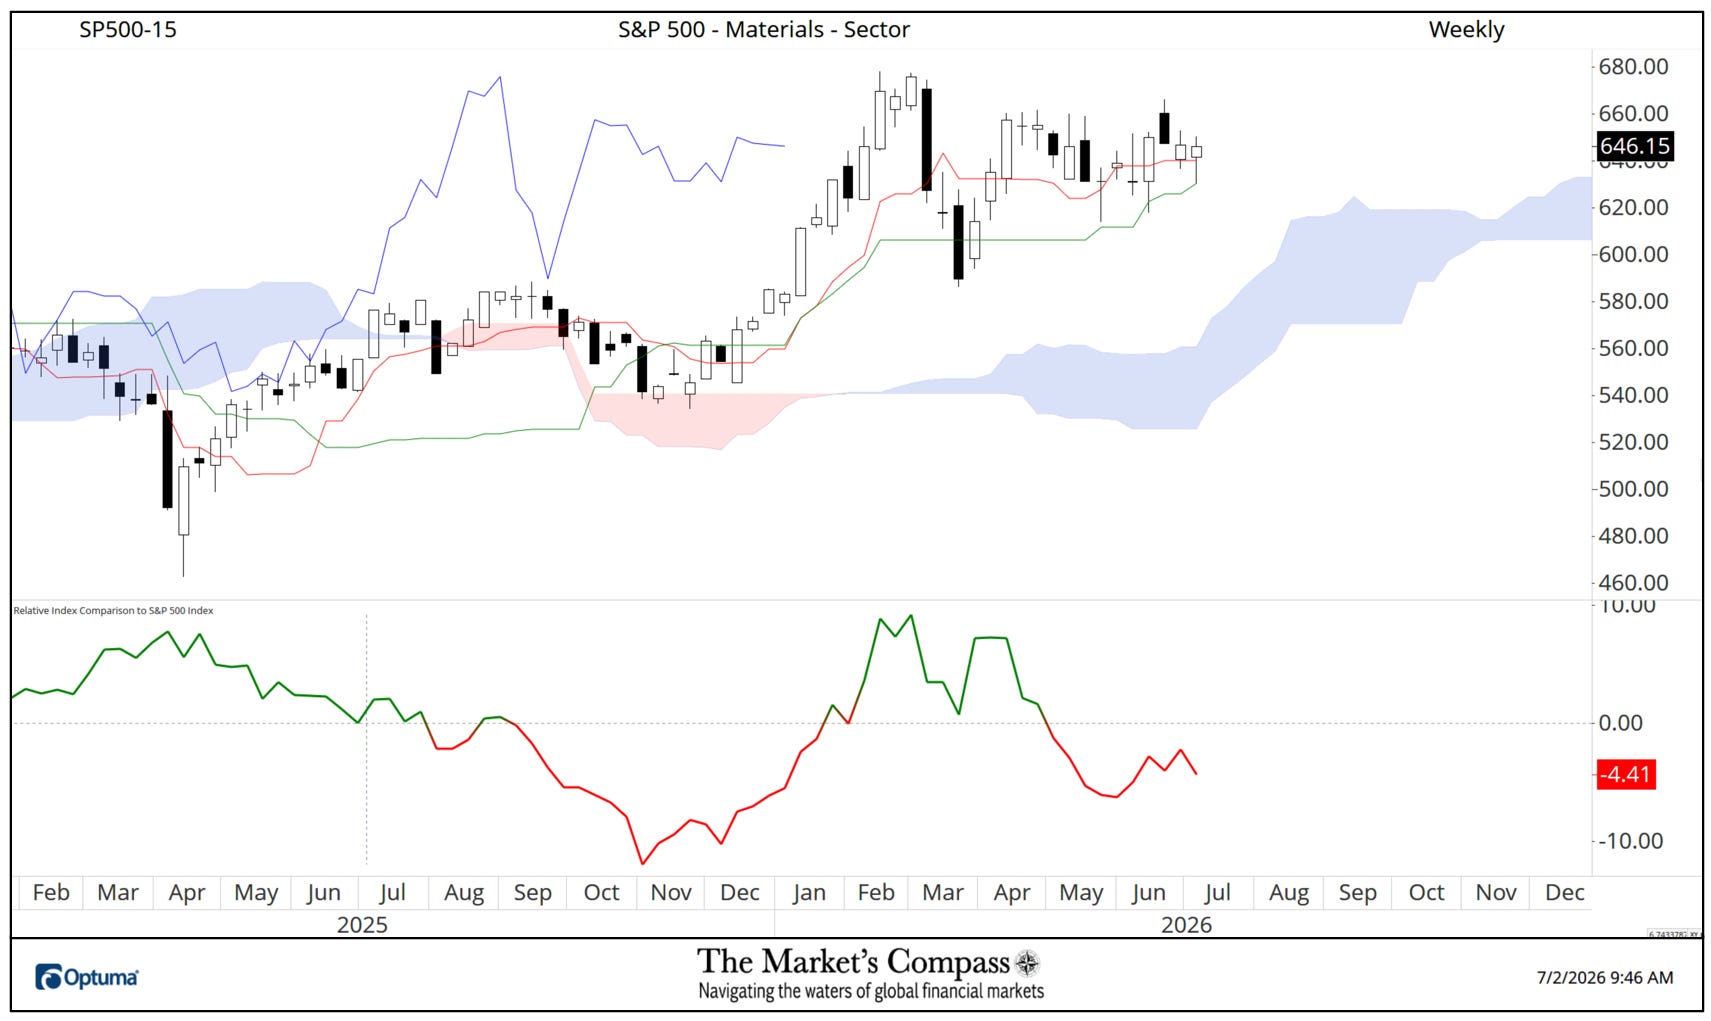
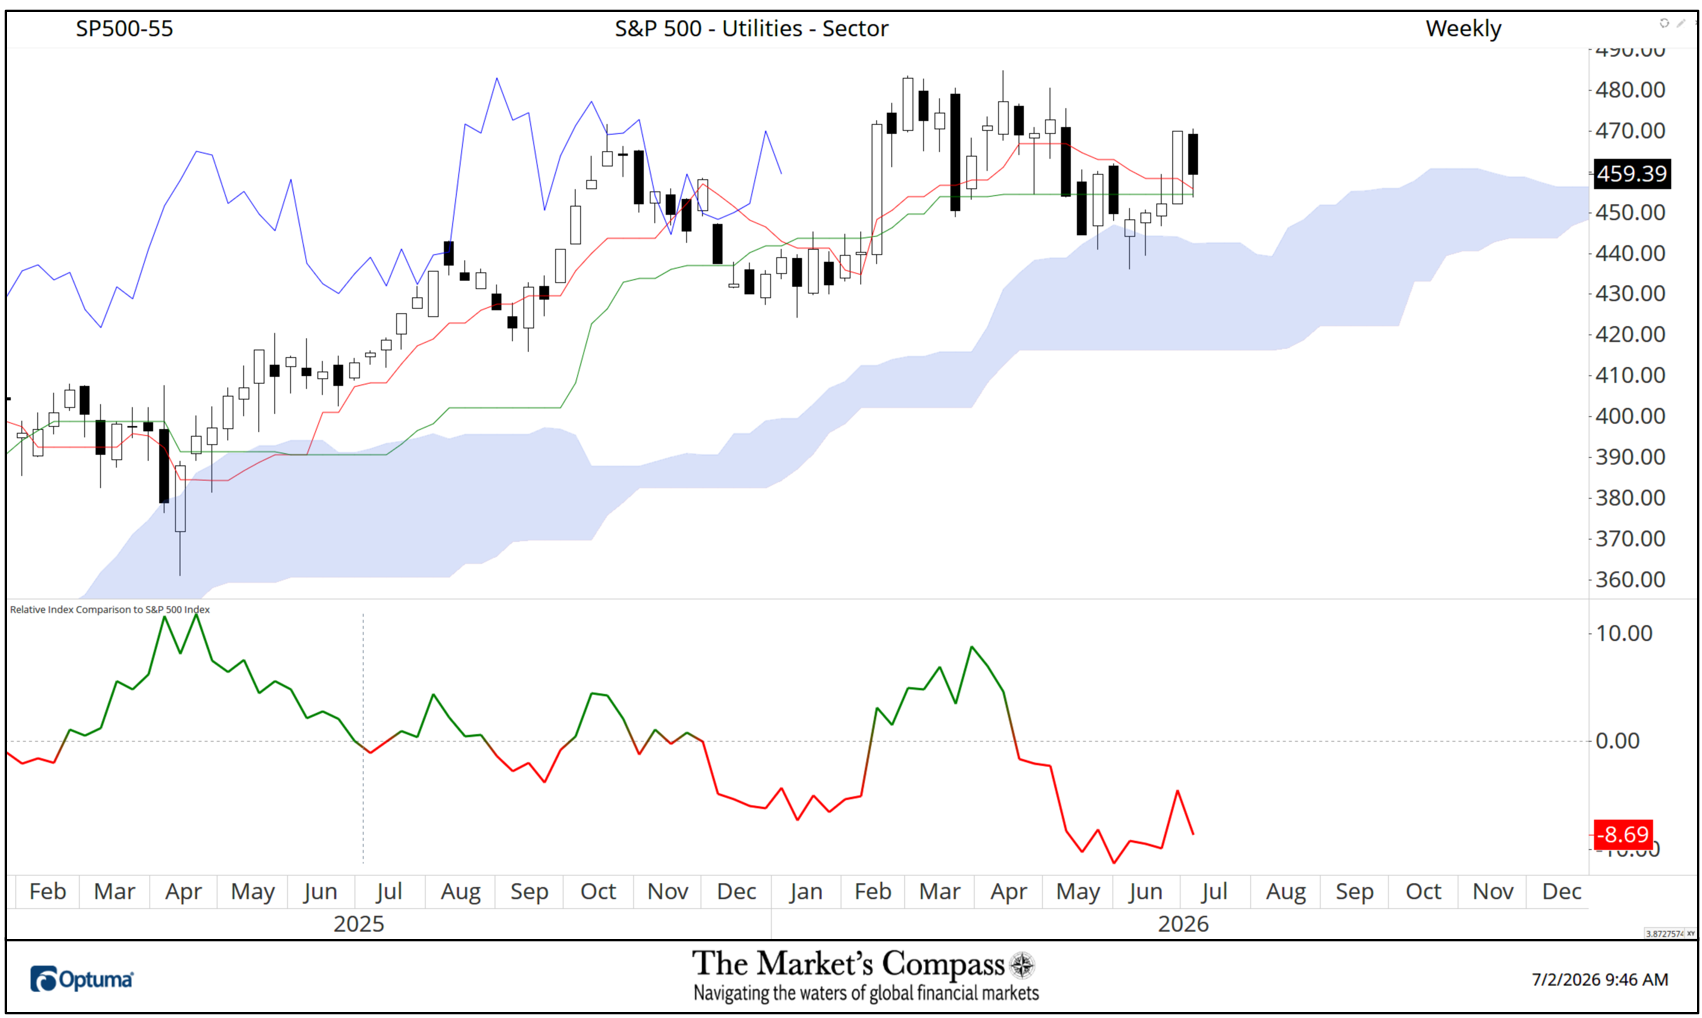
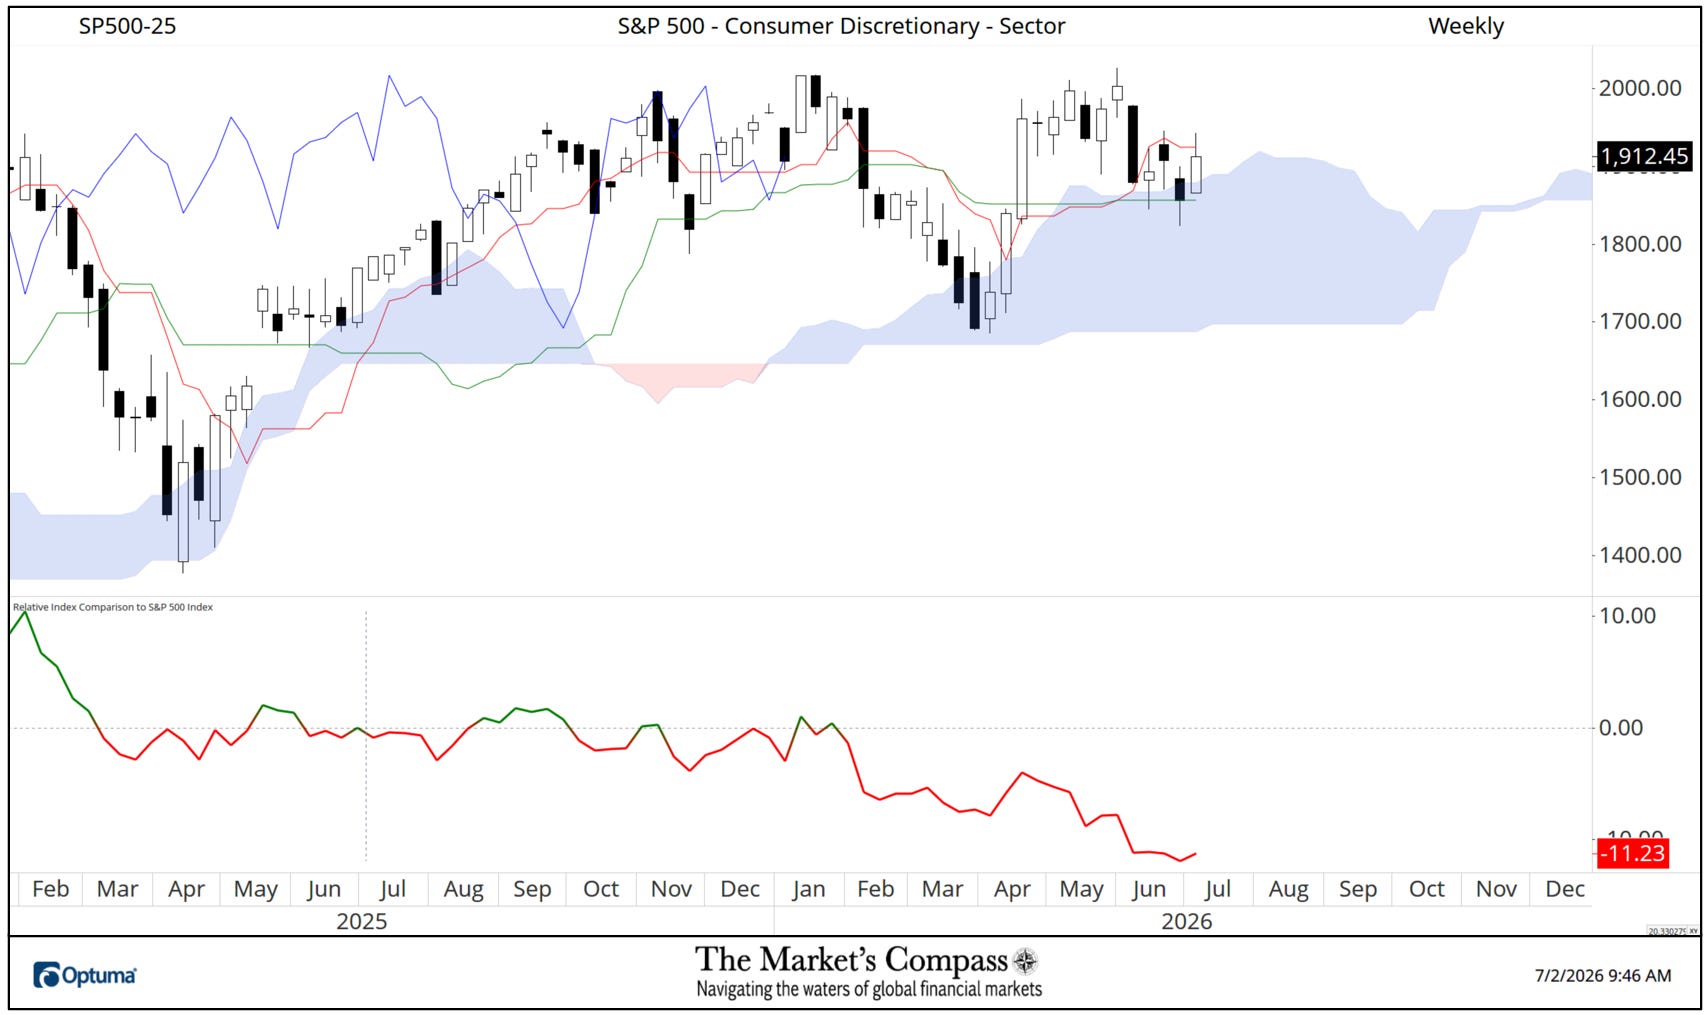
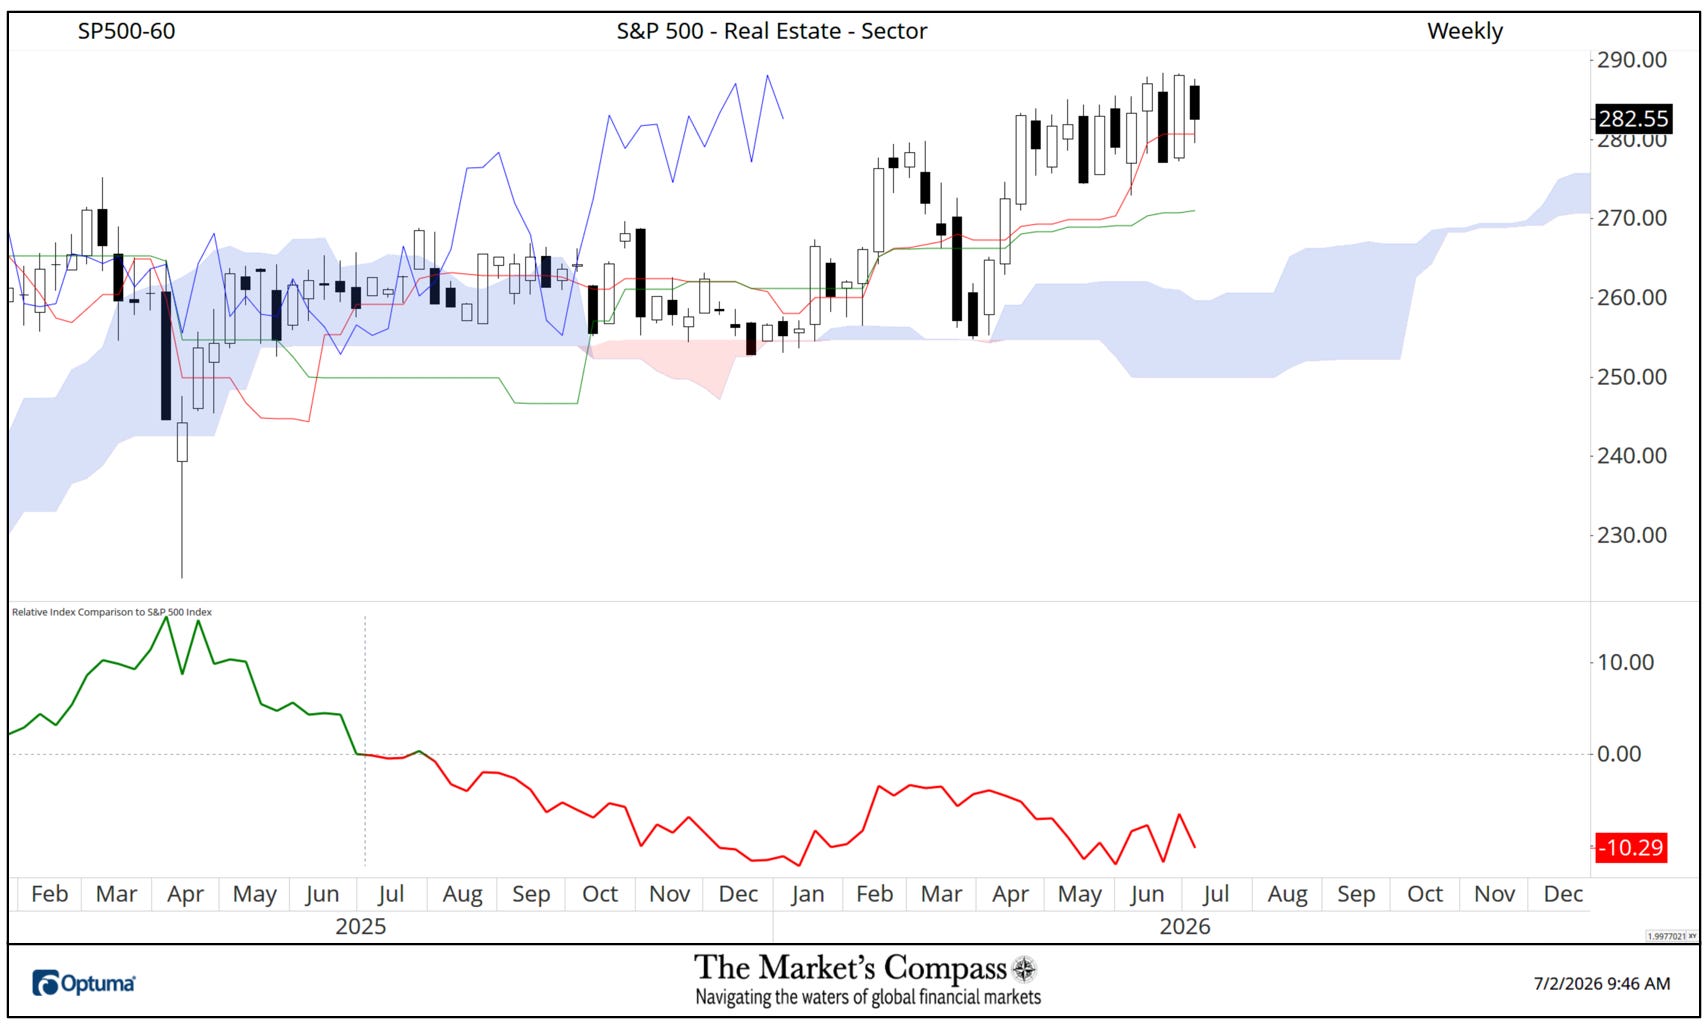
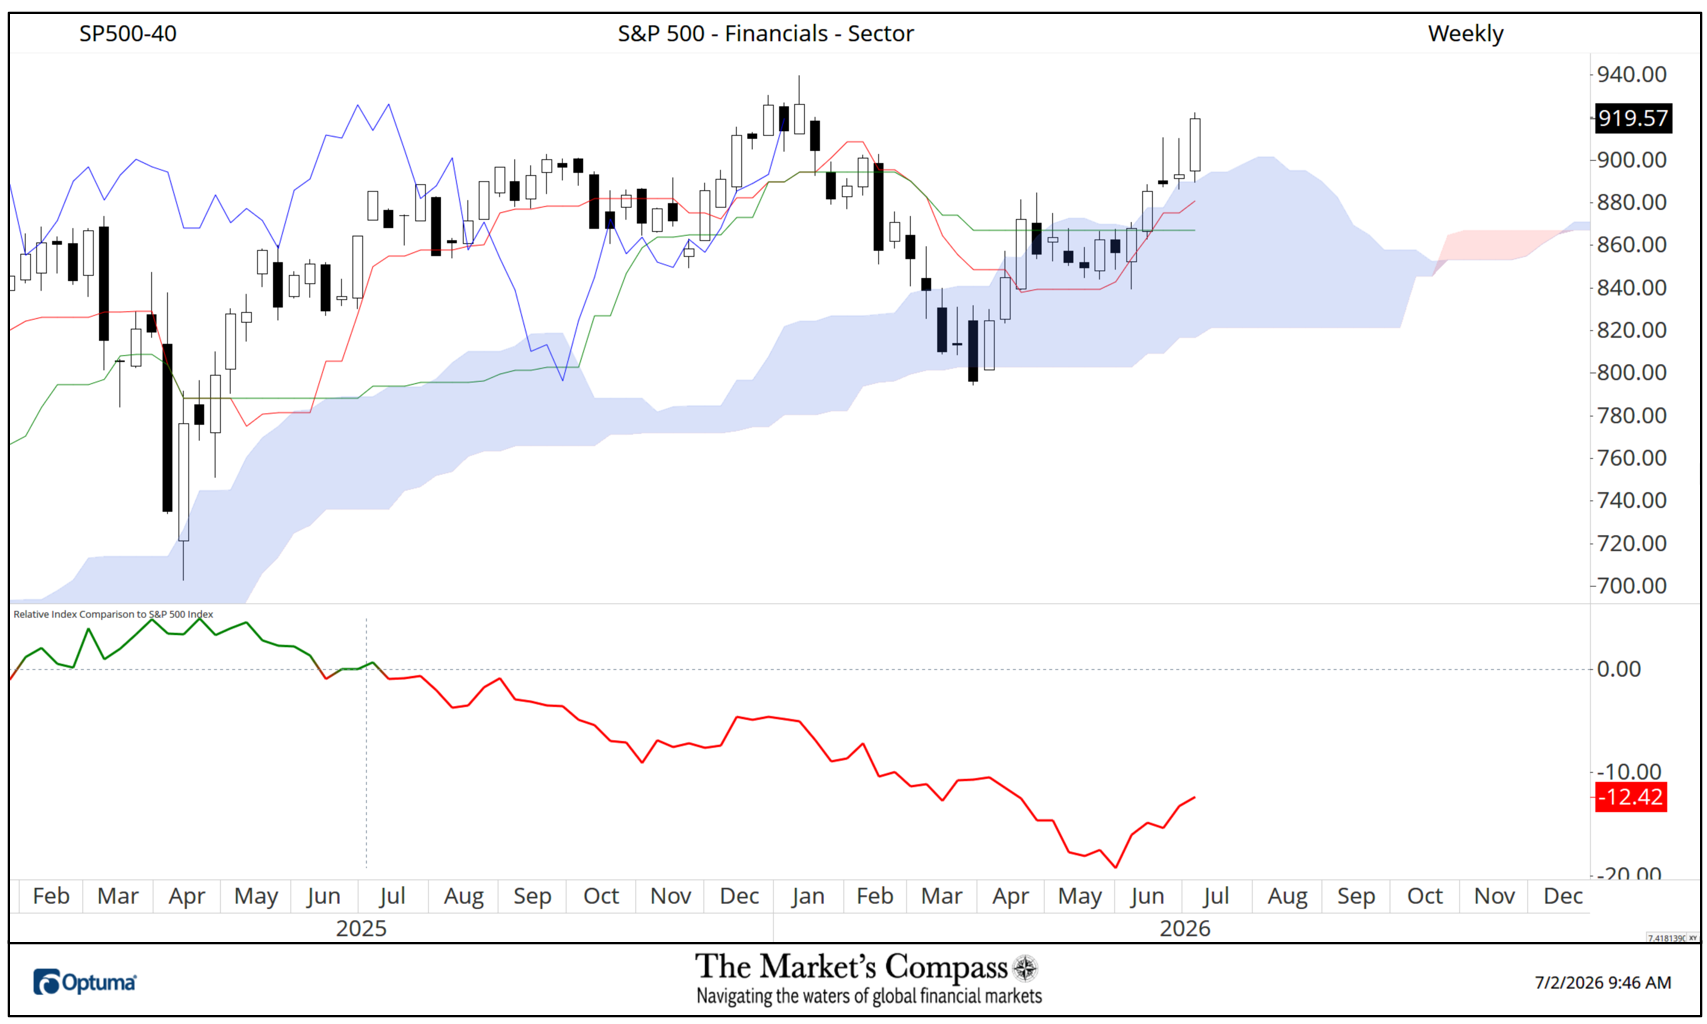
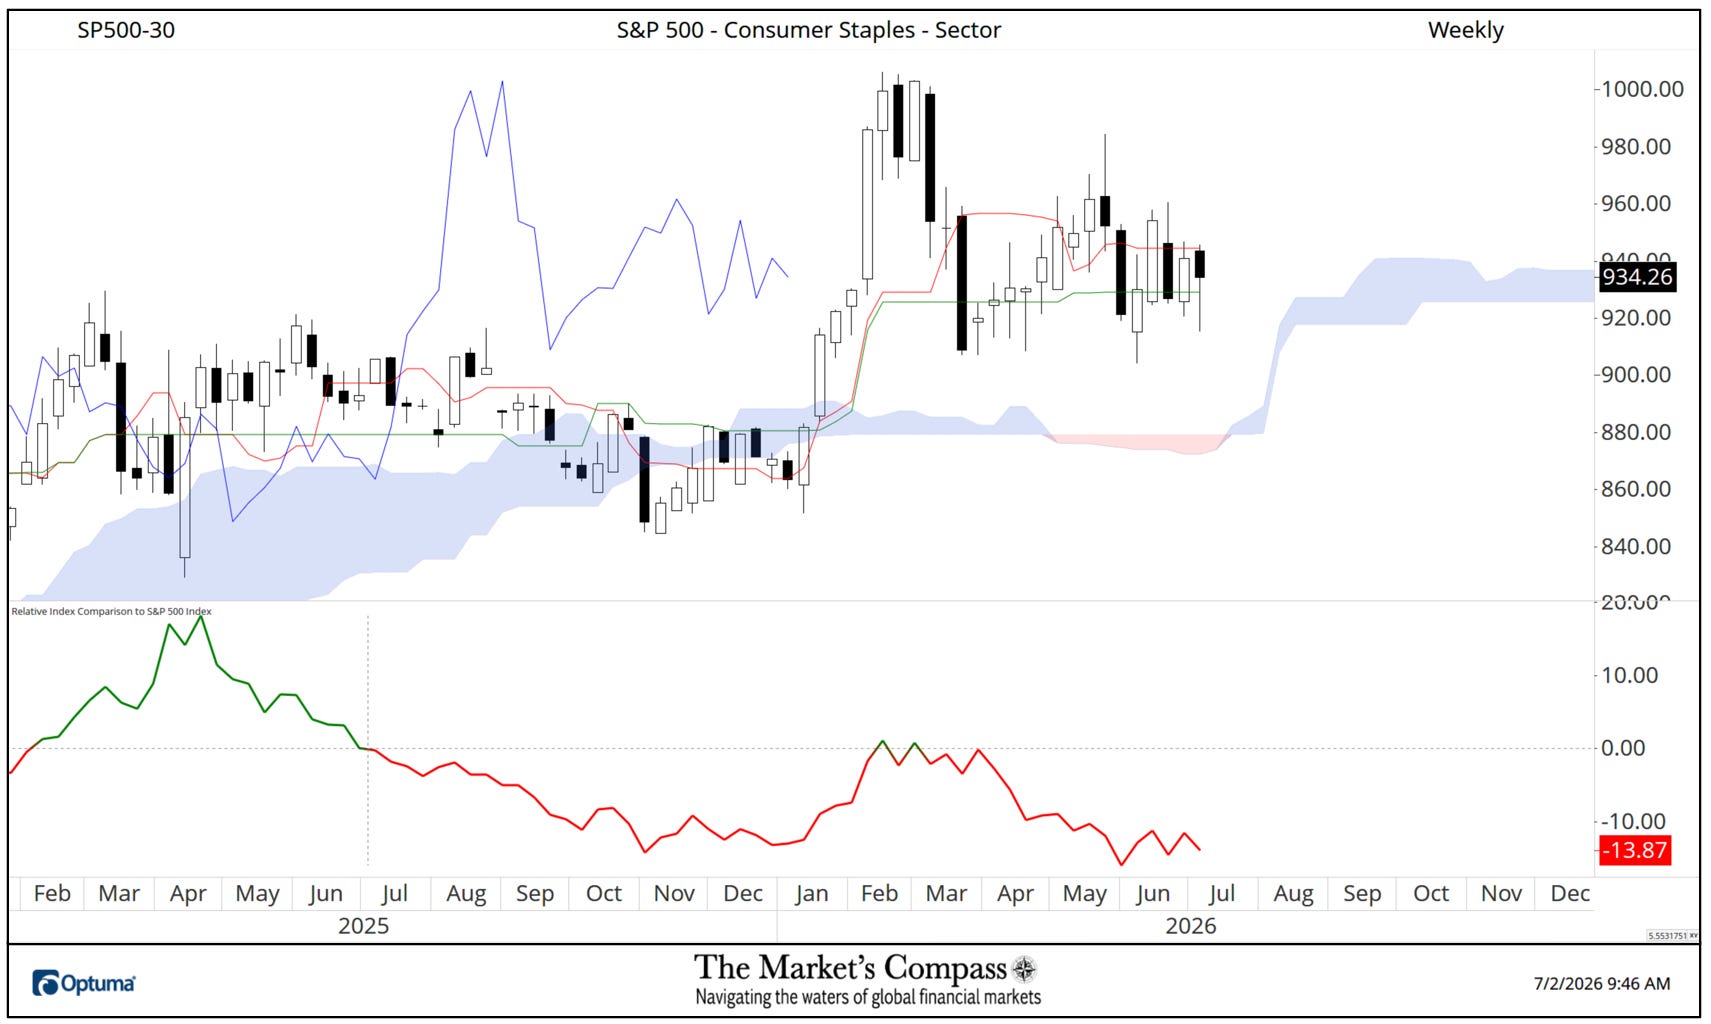
Charts are courtesy of Optuma whose charting software allows the Relative Strength to be charted as shown.
To receive a 30-day trial of Optuma charting software go to…
The Market's Compass Technical View is a reader-supported publication. To receive new posts and support my work, consider becoming a free or paid subscriber.