In the dynamic world of financial markets, traders and investors constantly seek tools and indicators to help them make informed decisions. One such tool that has gained immense popularity is the Moving Average Convergence Divergence, or simply MACD. In this article, we’ll explore what MACD is, how it works, and how you can use it effectively in your trading strategy.
What is MACD?
MACD, which stands for Moving Average Convergence Divergence, is a versatile and widely used trading indicator that provides valuable insights into the momentum and direction of price movements. Developed by Gerald Appel in the late 1970s, MACD has since become an essential component of many traders’ toolkits.
How Does MACD Work?
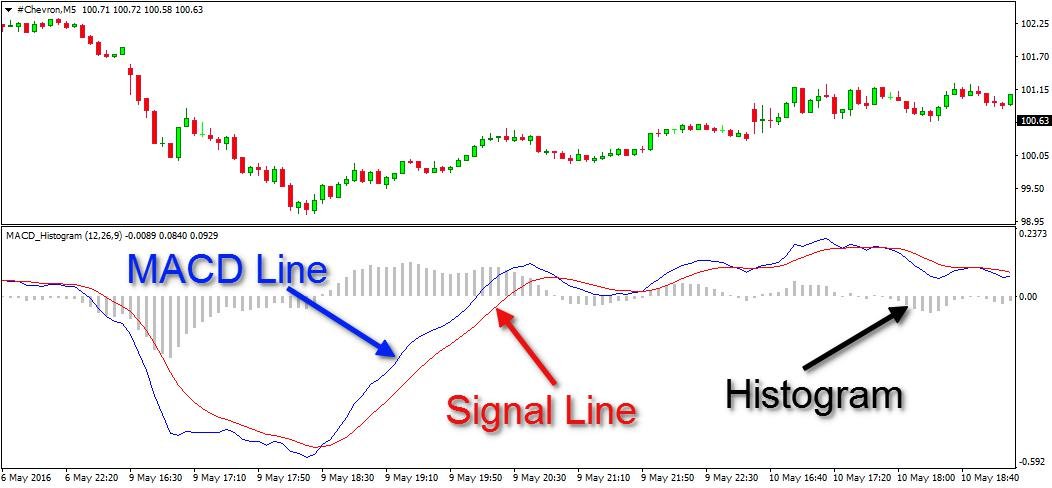
MACD is primarily composed of three key components:
- The MACD Line: This is the heart of the indicator and is calculated by subtracting the 26-period Exponential Moving Average (EMA) from the 12-period EMA. The result is a single line that moves above and below a centerline (the zero line) based on the relationship between these two EMAs.
- The Signal Line: The Signal Line is a 9-period EMA of the MACD Line. It is used to provide additional buy or sell signals when it crosses above or below the MACD Line.
- The Histogram: The Histogram represents the difference between the MACD Line and the Signal Line. It helps traders visualize the convergence and divergence between the two lines, indicating changes in momentum.
Interpreting MACD
Now that we know the components of MACD, let’s delve into how to interpret this indicator effectively:
- Crossovers: When the MACD Line crosses above the Signal Line, it generates a bullish signal, suggesting it might be a good time to buy. Conversely, when the MACD Line crosses below the Signal Line, it generates a bearish signal, indicating a potential selling opportunity.
- Histogram Peaks and Troughs: The Histogram can provide early signs of a potential trend reversal. Peaks and troughs in the Histogram suggest changes in momentum. A rising Histogram indicates increasing bullish momentum, while a falling Histogram suggests increasing bearish momentum.
- Divergence: MACD can also be used to identify the divergence between the indicator and the price chart. When the MACD Line diverges from the price, it can signal a potential trend reversal.
Practical Application of MACD
To understand how MACD is applied in real trading scenarios, let’s consider a hypothetical example:
Imagine you’re a swing trader monitoring a stock’s price chart. You notice that the MACD Line crosses above the Signal Line, generating a bullish signal. Simultaneously, the Histogram starts to rise, indicating increasing bullish momentum. This alignment of factors suggests a potential buying opportunity.
You enter a long position and set a stop-loss order to manage risk. As the price continues to rise, you keep an eye on the MACD indicator for potential signs of a trend reversal, such as a crossover or a decline in the Histogram.
When the MACD Line crosses below the Signal Line and the Histogram starts falling, it’s time to exit the trade, securing your profits. This simple yet effective strategy demonstrates how MACD can assist traders in making well-informed decisions.
MACD on Social Media
To get a sense of how traders discuss MACD on social media, let’s take a look at some recent tweets:
- @TraderJane: “MACD just signaled a strong bullish trend on $AAPL! 🚀 Time to ride the wave to profit town! #StockMarket #MACD #Bullish”
- @CryptoKing: “Watching #Bitcoin closely with MACD today. A potential bearish crossover on the horizon? 🧐 #Crypto #MACD #Trading”
These tweets reflect how traders use MACD as part of their analysis and trading strategies, highlighting its importance and versatility in various markets.
Conclusion
The Moving Average Convergence Divergence (MACD) is a valuable trading indicator that offers insights into market momentum and potential trend changes. By understanding its components and interpreting its signals, traders can make more informed decisions and improve their trading strategies.
Whether you’re a seasoned trader or just starting, incorporating MACD into your toolkit can be a game-changer. Remember that no single indicator guarantees success, so always use MACD in conjunction with other forms of analysis and risk management techniques.
Now that you have a better understanding of MACD, it’s time to put it to use in your trading endeavors. Stay tuned for more insightful articles on trading strategies and indicators!

